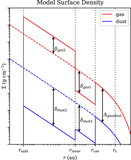
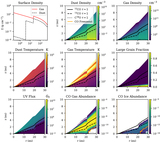
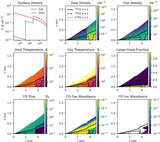
Image Details
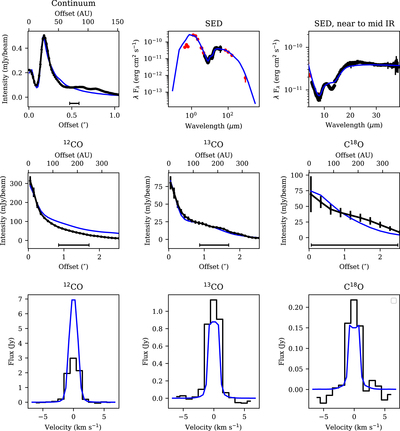
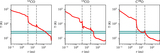
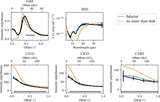
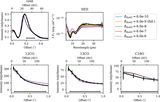
Caption: Figure 5.
Comparison of the DM Tau observations (black lines and red circles for SED photometry) and fiducial model (blue lines). Top row: deprojected and azimuthally averaged millimeter-continuum intensity, overall SED, and SED zoomed in on the near-to-mid infrared region. Middle row: deprojected and azimuthally averaged intensity for the moment 0 maps of the 12CO, 13CO, and C18O lines. Bottom row: flux integrated over the disk vs. velocity for the 12CO, 13CO, and C18O line cubes. The spectral resolution of the observed line cubes is 1 km s−1, while the models are sampled in 0.5 km s−1 steps.
Other Images in This Article
Show More
Copyright and Terms & Conditions
© 2022. The Author(s). Published by the American Astronomical Society.
Copyright ©
2025 Astronomy Image Explorer. All Rights Reserved.