Image Details
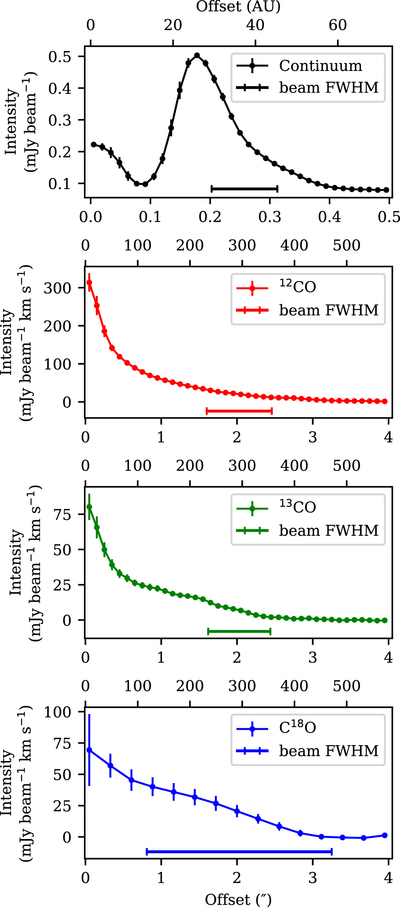
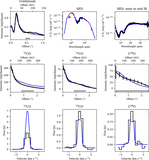
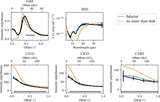
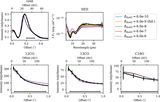
Caption: Figure 2.
Deprojected and azimuthally averaged intensity profiles of the 1.3 mm dust continuum and moment 0 maps for each observed CO line. The FWHM of the beam is shown by the scalebar.
Other Images in This Article
Show More
Copyright and Terms & Conditions
© 2022. The Author(s). Published by the American Astronomical Society.
Copyright ©
2025 Astronomy Image Explorer. All Rights Reserved.