Image Details
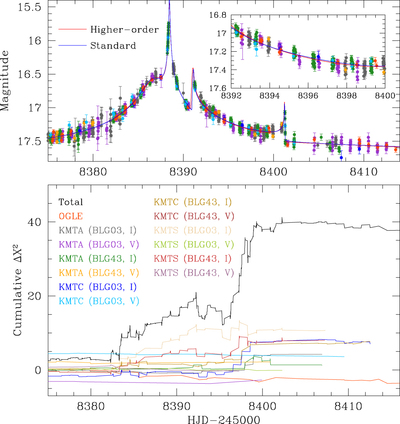
Caption: Figure 5.
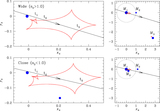
Comparison of models with and without the consideration of higher-order effects. The model curves of the two solutions are presented in the upper panel, in which the red and blue curves are for the solutions with and without higher-order effects, respectively. The lower panel shows the cumulative distributions of ﹩{\rm{\Delta }}{\chi }^{2}﹩ between the two solutions. The inset in the upper panel shows the zoomed-in region of ﹩8392\lesssim {\mathrm{HJD}}^{{\prime} }\equiv \mathrm{HJD}-{\rm{2450,000}}\lesssim 8400﹩, during which a major fit improvement occurs. The presented model light curves are for the solutions with s3 < 1.0 and u0 > 0.0.
Other Images in This Article
Copyright and Terms & Conditions
© 2020. The American Astronomical Society. All rights reserved.