Image Details
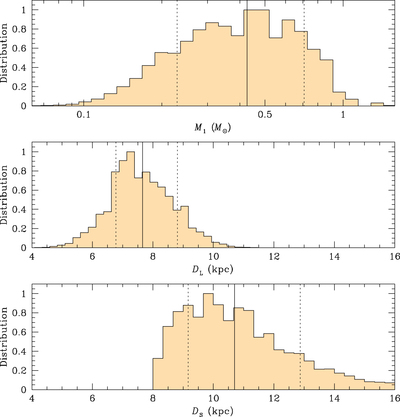
Caption: Figure 8.
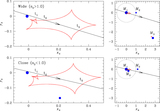
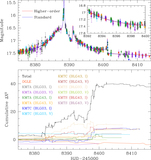
Probability distributions of the primary-lens mass, M1 (top panel), distance to the lens, DL (middle panel), and the distance to the source, DS (bottom panel), obtained from the Bayesian analysis. For each distribution, the solid vertical line represents the median value and the two dotted lines represent the 68% range of the distribution. The distributions are for the wide solution and the close solution results in nearly identical distributions.
Other Images in This Article
Copyright and Terms & Conditions
© 2020. The American Astronomical Society. All rights reserved.
Copyright ©
2026 Astronomy Image Explorer. All Rights Reserved.