Image Details
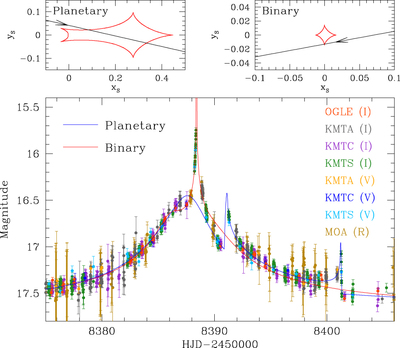
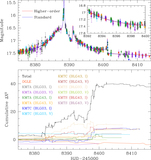
Caption: Figure 2.
Decomposition of the anomaly into two parts produced by two binary-lens single-source (2L1S) events. The blue and red curves are the models of the 2L1S solutions obtained by fitting two sets of data, for each of which a part of the data is excluded. For the first data set, the data in the region ﹩8387.0\lt {\mathrm{HJD}}^{{\prime} }\equiv \mathrm{HJD} \mbox{-} {\rm{2450,000}}\lt 8395.5﹩ are excluded, while for the second set, the data in the region 8389.5 < HJD′ < 8405.0 are excluded. The 2L1S fit to the first data set results in a 2L1S solution (blue curve) with a very low mass ratio of q ∼ 0.01, and thus we designate the model as planetary. The fit to the second data set (red curve), on the other hand, results in q ∼ 0.3, and thus the solution is designated as binary. The upper panels show the lens system configurations of the planetary (left panel) and binary (right panel) solutions. For each panel, the closed concave curve represents the caustic and the line with an arrow indicates the source trajectory.
Other Images in This Article
Copyright and Terms & Conditions
© 2020. The American Astronomical Society. All rights reserved.