Image Details
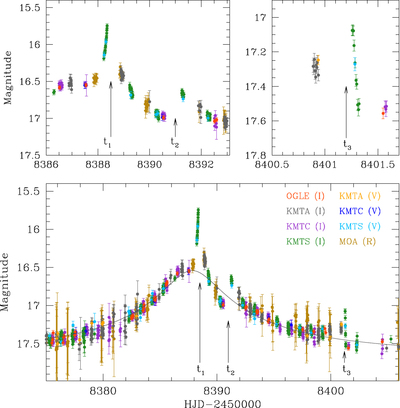
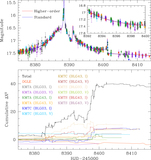
Caption: Figure 1.
Light curve of the microlensing event OGLE-2018-BLG-1700. The lower panel shows the whole view of the event and the upper panels show zooms of the regions around the three peaks at the times marked by t1, t2, and t3. The colors of the labels for the telescopes used for observations match those of the data points. The curve superposed on the data points is the model obtained from single-lens and single-source (1L1S) fitting of the data excluding the data points around the anomaly peak at t1.
Other Images in This Article
Copyright and Terms & Conditions
© 2020. The American Astronomical Society. All rights reserved.
Copyright ©
2024 Astronomy Image Explorer. All Rights Reserved.