Image Details
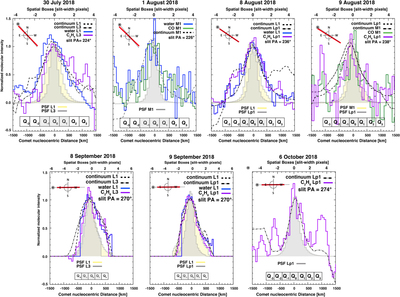
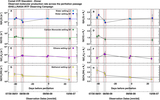
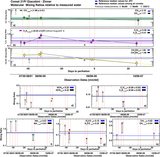
Caption: Figure 2.
Spatial profiles measured for the brightest lines of water, ethane, and carbon monoxide in 21P/Giacobini–Zinner during this observing campaign. The normalized molecular intensity (y-axis, relative units) is reported with respect to the nucleus-centered distance (x-axis, units of kilometers and spaxels (slit-width pixels)). Inside the panels, we show the spatial boxes that define the integration area in which we computed the nucleus-centered and the terminal production rates and from which we evaluated the growth factor for each setting. The spatial box (Q0) is located at the center of the peak of continuum intensity as determined by the spatial analysis and it spans 5 × 5 pixels. In the panels the outgassing profile for multiple molecular volatiles are shown in different colors and compared to the cometary continuum profile (dashed black lines) of each setting. The full light gray and yellow profiles represent the measured profile on the star for different settings, and represents the quality of the seeing during our observations. The Sun’s position angle and the slit position angle (in red) are shown on the upper left corner of each panel.
Other Images in This Article
Copyright and Terms & Conditions
© 2019. The American Astronomical Society. All rights reserved.