Image Details
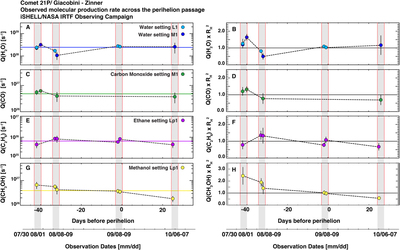
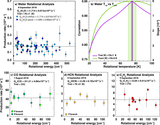
Caption: Figure 5.
Overview of molecular production rates in 21P/Giacobini–Zinner. In the graphics, each color is distinctive of a specific molecule. Water is represented (panels A and B) in two different shades of blue according to the different iSHELL settings in which it was measured. We show CO in green (panels C and D), ethane in purple (panels E and F), and methanol in yellow (panels G and H). For each molecule, the left panels (e.g., A, C, E, G) present the total molecular production rates retrieved during the observing campaign, while the right panels (e.g., B, D, F, H) show the outgassing variability after correcting for insolation (these represent the specific production rates relative to perihelion values; see Mumma et al. 2003). The values are normalized to the weighted mean value for each species.
Other Images in This Article
Copyright and Terms & Conditions
© 2019. The American Astronomical Society. All rights reserved.