Image Details
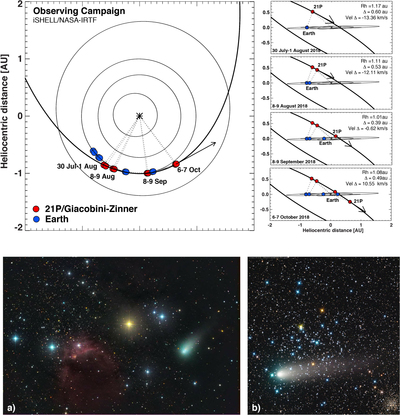
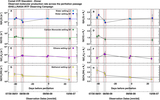
Caption: Figure 1.
Comet 21P/Giacobini–Zinner orbit diagram and visual aspect during the perihelion passage. The upper graphics show the top view and lateral views of the ecliptic plane and the orbit of comet 21P/Giacobini–Zinner during the 2018 observing campaign. For each observing run the position of comet 21P/G-Z (red) and Earth (blue) are reported together with the dates of observations. The four right graphics report the mean cometary heliocentric distance Rh, the geocentric distance Δ, and geocentric velocity v = dΔdt or delta-dot, for each observing run. Bottom pictures show comet 21P/G-Z on July 23 (panel a) and on September 15 (panel b). Images credit: Rolando Ligustri.
Other Images in This Article
Copyright and Terms & Conditions
© 2019. The American Astronomical Society. All rights reserved.