Image Details
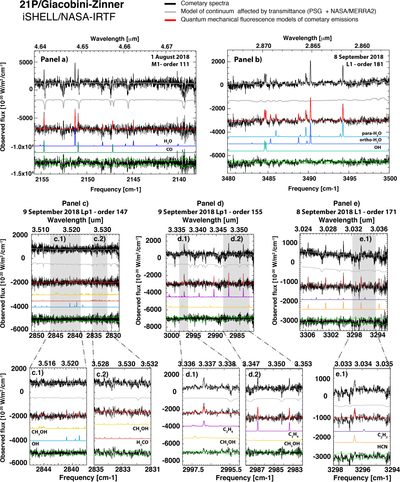
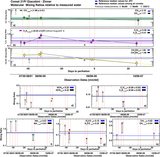
Caption: Figure 3.
Extracted Spectra for 21P/Giacobini–Zinner and the excitation analysis. Panels show cometary spectra extracted from specific orders of the four iSHELL echellograms. Cometary spectra are shown and compared with optimized synthetic spectra for detected species. The modeled emission spectra are shown shifted downward along the y-axis relative to the residual cometary spectrum, for clarity. The lowest trace in each panel is the grand residual after subtracting the modeled emissions from the measured molecular residual; the expected stochastic noise envelope (±σ) is shown in light green. Panels (f)–(h) show the emission lines detected in zoomed portions of the spectral orders in panels (c)–(e) (highlighted by gray boxes).
Other Images in This Article
Copyright and Terms & Conditions
© 2019. The American Astronomical Society. All rights reserved.