Image Details
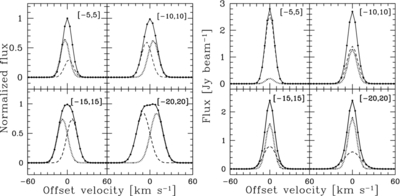
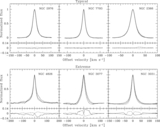
Caption: Figure 27.
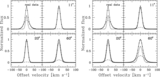
Examples of simulated super profiles derived by giving all input spectra (left panel) and low-amplitude spectra (right panel) uniform random offsets. The dotted and the dashed lines represent the narrow and broad components required in the double Gaussian fitting. The solid black lines represent the results from the double Gaussian fitting.
Other Images in This Article
Show More
Copyright and Terms & Conditions
© 2012. The American Astronomical Society. All rights reserved.
Copyright ©
2025 Astronomy Image Explorer. All Rights Reserved.