Image Details

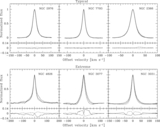
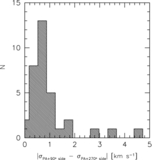
Caption: Figure 3.
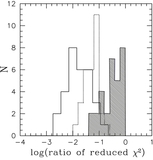
Histograms of velocity dispersions derived from both one- and two-component Gaussian fits. The dotted-line histogram represents the velocity dispersions derived from the single Gaussian fit. The solid-line and hatched histograms represent the velocity dispersions of the double Gaussian narrow and broad components, respectively.
Other Images in This Article
Show More
Copyright and Terms & Conditions
© 2012. The American Astronomical Society. All rights reserved.
Copyright ©
2025 Astronomy Image Explorer. All Rights Reserved.