Image Details
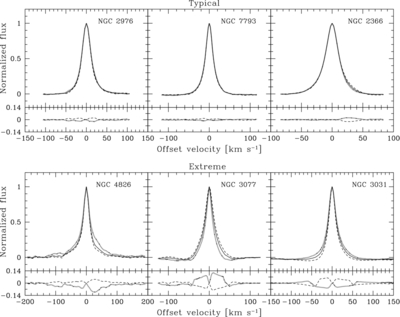
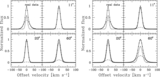
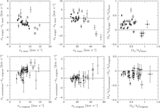
Caption: Figure 9.
Super profiles extracted from the opposite sides of the major axes of each galaxy. The super profiles from the two halves of each galaxy are represented as dashed and dotted lines. The overall super profiles are represented by the solid lines. At the bottom of each panel is the difference between the super profiles from the two sides and the total super profiles. Note that the super profiles are normalized to their peak values.
Other Images in This Article
Show More
Copyright and Terms & Conditions
© 2012. The American Astronomical Society. All rights reserved.
Copyright ©
2025 Astronomy Image Explorer. All Rights Reserved.