Image Details
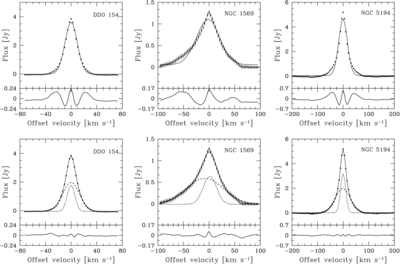
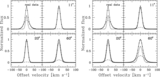
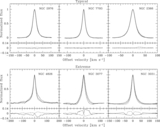
Caption: Figure 1.
Three examples of super profiles for the THINGS galaxies (the rest are shown in Appendix A). For each galaxy, we show the results from the single (top panel) and double (bottom panel) Gaussian fitting. The bottom panel of each plot show the residuals from the fits. Filled circles indicate the data. The solid lines represent the results from the single and double Gaussian fitting. The dotted and the dashed lines represent the narrow and broad components required in the double Gaussian fitting. We plot error bars as 3σ error bars, though in most cases they are smaller than the symbols plotted.
Other Images in This Article
Show More
Copyright and Terms & Conditions
© 2012. The American Astronomical Society. All rights reserved.