Image Details
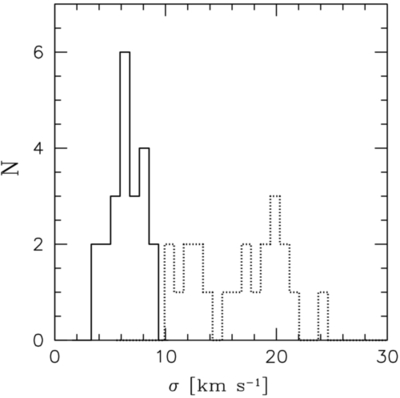
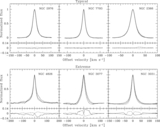
Caption: Figure 21.
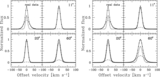
Histograms of the velocity dispersion of the clean sample. The solid line histogram represents the narrow component. The dotted line histogram represents the broad component.
Other Images in This Article
Show More
Copyright and Terms & Conditions
© 2012. The American Astronomical Society. All rights reserved.
Copyright ©
2025 Astronomy Image Explorer. All Rights Reserved.