Image Details
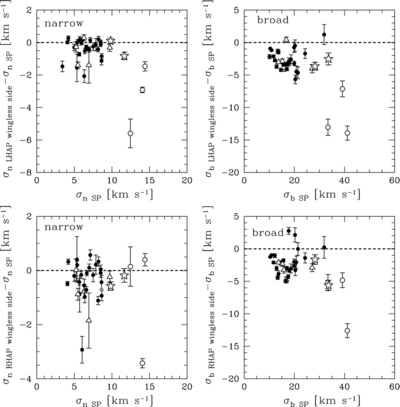
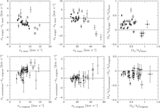
Caption: Figure 20.
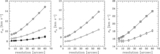
Comparison of the velocity dispersions derived from the SP super profiles to those derived from the wingless sides of the LHAP (top panel) and RHAP (bottom panel) super profiles using |Δ H − I | ⩽ 2 km s −1. The dashed lines are lines of equality. Symbols are as in Figure 8.
Other Images in This Article
Show More
Copyright and Terms & Conditions
© 2012. The American Astronomical Society. All rights reserved.
Copyright ©
2025 Astronomy Image Explorer. All Rights Reserved.