Image Details
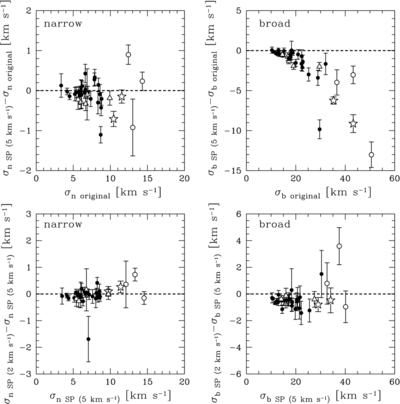
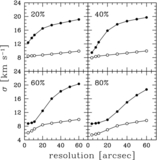
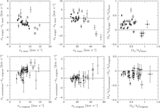
Caption: Figure 19.
Top panels: comparison of the velocity dispersions of the original super profiles to those derived from SP profiles using |Δ H − I | ⩽ 5 km s −1. Bottom panel: comparison of the velocity dispersions derived from SP profiles using the |Δ H − I | ⩽ 5 km s −1 with those derived from SP profiles using |Δ H − I | ⩽ 2 km s −1. Dashed lines are lines of equality. Symbols are as in Figure 8.
Other Images in This Article
Show More
Copyright and Terms & Conditions
© 2012. The American Astronomical Society. All rights reserved.
Copyright ©
2025 Astronomy Image Explorer. All Rights Reserved.