Image Details
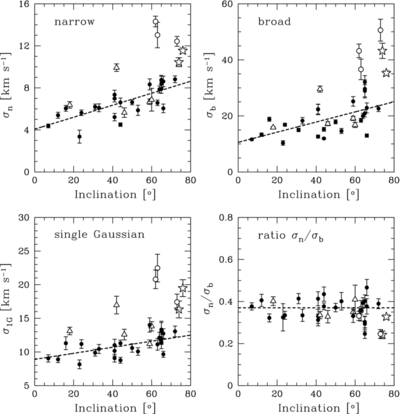
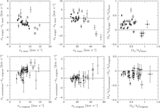
Caption: Figure 16.
Relation between inclination and measured velocity dispersion. All error bars are 3σ error bars. The top left panel is for the narrow component. The top right panel is for the broad component and the bottom left panel is for the single Gaussian component. The dashed lines are linear least-squares fits with slopes of 0.045 ± 0.014 for the single Gaussian component, 0.057 ± 0.010 for the narrow component, and 0.18 ± 0.05 for the broad component. Note that only the filled data points were used in these fits. The bottom right panel is a plot of the ratio of the narrow and broad component velocity dispersions against inclination. The dashed line represents the weighted average value of σ n /σ b ⋍ 0.37 ± 0.04. Symbols follow Figure 8.
Other Images in This Article
Show More
Copyright and Terms & Conditions
© 2012. The American Astronomical Society. All rights reserved.