Image Details
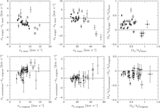
Caption: Figure 14.
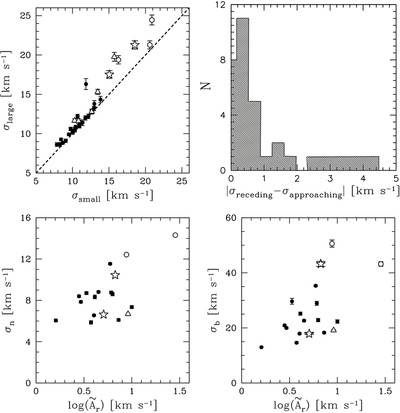
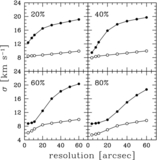
Top left panel: comparison of the widths of the super profiles from the approaching and receding sides of the galaxies. The
largest of each of these velocity dispersions is represented by σ
large and the smallest one by σ
small. The dashed line represents the line of equality. Top right panel: histogram of the difference between the velocity dispersion
derived from the approaching and receding halves of the galaxies. Bottom left panel: narrow component velocity dispersion
as a function of the amplitudes of non-circular motions,
 , derived by Trachternach et al. (2008). Bottom right panel: broad component velocity dispersion as a function of
 . Note that only the 18 galaxies that are part of Trachternach et al. (2008) sample are shown here. Symbols are as in Figure
8.
. Note that only the 18 galaxies that are part of Trachternach et al. (2008) sample are shown here. Symbols are as in Figure
8.
Other Images in This Article
Show More
Copyright and Terms & Conditions
© 2012. The American Astronomical Society. All rights reserved.