Image Details
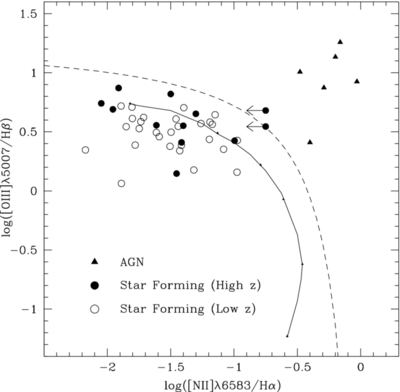
Caption: Figure 9.
Emission-line ratio diagnostic diagram for the Hα dots. Hα-detected (open symbols) vs. [O iii]-detected objects (filled symbols) are distinguished from each other, as are star-forming galaxies (circles) vs. AGNs (triangles). The dashed line is from Kauffmann et al. (2003) and delineates regions in the diagram occupied by star-forming galaxies and narrow-line AGNs. The solid line represents a locus of H ii region model points from Dopita & Evans (1986), where the metallicity of the models vary smoothly from high values in the lower right to low values in the upper left.
Other Images in This Article
Show More
Copyright and Terms & Conditions
© 2012. The American Astronomical Society. All rights reserved.
Copyright ©
2025 Astronomy Image Explorer. All Rights Reserved.