Image Details
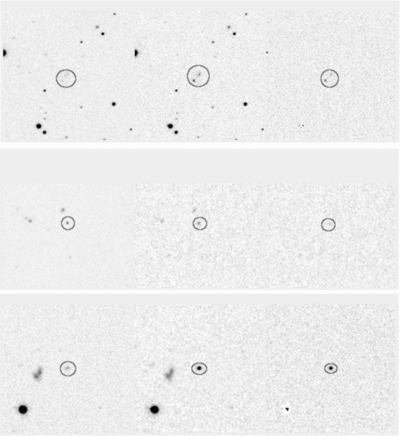
Caption: Figure 3.
Example Hα dots. Each panel consists of three 200 × 200 pixel cutouts (120 × 120 arcsec) centered on the putative Hα dot. From left to right are the R, Hα, and continuum-subtracted Hα images. The top panel shows Hα dots 39 and 40 (two Hα dots that are in close proximity), the middle panel shows Hα dot 27, and the lower set of images represents Hα dot 31. Notice that the various Hα dots are all relatively faint in the broadband image, but have a wide range of brightnesses in the narrow band.
Other Images in This Article
Show More
Copyright and Terms & Conditions
© 2012. The American Astronomical Society. All rights reserved.
Copyright ©
2025 Astronomy Image Explorer. All Rights Reserved.