Image Details
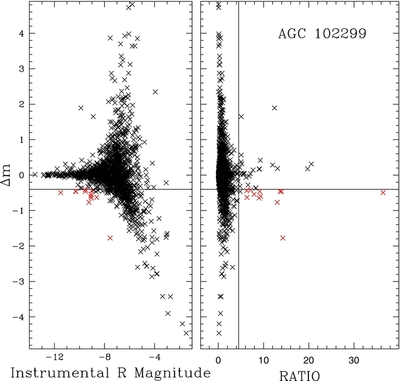
Caption: Figure 2.
Diagnostic plot for the ALFALFA Hα field containing AGC 102299. The left panel is a plot of Δ m vs. R instrumental magnitude (brighter objects on the left) and on the right is a plot of Δ m vs. ratio. The horizontal line indicates a Δ m cutoff of −0.4 and the vertical line indicates a ratio cutoff of 4.5. Each "×" symbolizes an individual object in the image. Objects in the lower right-hand region in the right-hand panel (shown in red in both plots), with Δ m less than −0.4 and a ratio larger than 4.5, are potential Hα dot candidates.
Other Images in This Article
Show More
Copyright and Terms & Conditions
© 2012. The American Astronomical Society. All rights reserved.
Copyright ©
2025 Astronomy Image Explorer. All Rights Reserved.