Image Details
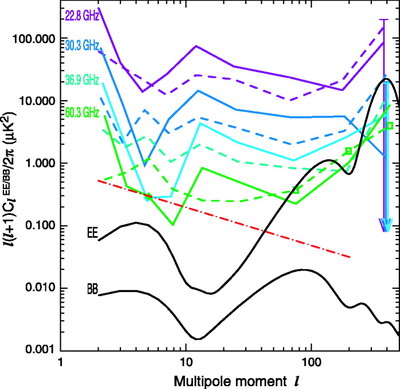
Caption: Fig. 17.
Absolute value of the EE (solid lines, violet through green) and BB (dashed lines, violet through green) polarization spectra for the region outside the P06 mask. The best‐fit ΛCDM model to TT, TE, and EE data with ﹩\tau =0.09﹩ and an additional tensor contribution with ﹩r=0.3﹩ is shown in black. The cross spectra have been combined into frequency bins according to Table 5 and into the following ﹩l﹩ bins: [2, 3, 4–5, 6–8, 9–15, 16–32, 33–101, 102–251, 252–502]. In the presence of a dominant synchrotron spectrum, the averages over frequency are dominated by contributions from the lowest frequencies as can be seen by comparing the above at ﹩l=2﹩ to Fig. 18. Diamonds (EE) and boxes (BB) denote the data points that are negative. The points are plotted at their absolute value to limit clutter. They should be interpreted as indicating the approximate noise level of the measurement. The 1 σ upper bounds and downward arrows mark points that are positive but consistent with zero. The general rise in the data for ﹩l> 100﹩ is due to the large noise term. The red line corresponds to eq. (25) evaluated for ﹩\nu =60\ ﹩GHz for the BB foreground emission.
Other Images in This Article
Show More
Copyright and Terms & Conditions
© 2007. The American Astronomical Society. All rights reserved. Printed in U.S.A.