Image Details

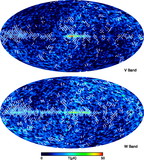
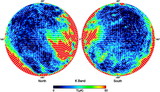
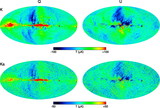
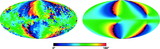
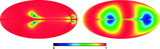
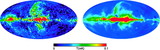
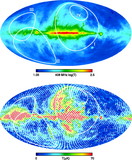
Caption: Fig. 3.
P and γ maps for the K, Ka, and Q bands in Galactic coordinates. See Fig 4 of Bennett et al. (2003b) for features and coordinates. There is only one polarization map for the K and Ka bands. For the Q band, there are two maps that have been co‐added. The maps are smoothed to 2°. The polarization vectors are plotted whenever a r4 HEALPix pixel (see § 4.2, roughly ﹩4^{\circ }\times 4^{\circ }﹩) and three of its neighbors have a signal‐to‐noise ratio (P/N) greater than unity. The length of the arrow is logarithmically dependent on the magnitude of P. Note that P is positive. Maps of the noise bias have been subtracted in these images.
Other Images in This Article
Show More
Copyright and Terms & Conditions
© 2007. The American Astronomical Society. All rights reserved. Printed in U.S.A.