Image Details
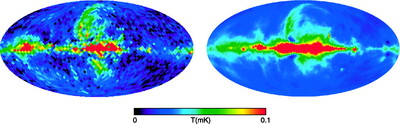
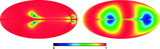
Caption: Fig. 9.
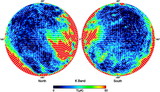
Left: Observed K‐band polarization, P. The color scale ranges from 0 to 0.1 mK. Right: Model prediction of the K‐band polarization based on the Haslam intensity map. The model has one effective free parameter, the ratio of the homogeneous field strength to the total field strength as shown in eq. (13). This plot shows the results for ﹩\beta _{s}=-2.7﹩ and ﹩q=0.7﹩.
Other Images in This Article
Show More
Copyright and Terms & Conditions
© 2007. The American Astronomical Society. All rights reserved. Printed in U.S.A.
Copyright ©
2025 Astronomy Image Explorer. All Rights Reserved.