Image Details
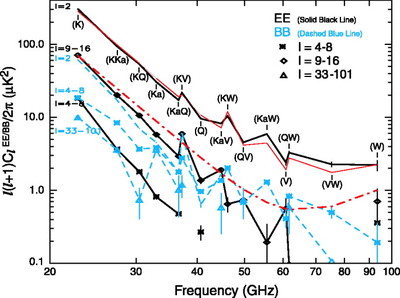
Caption: Fig. 18.
Frequency spectrum of the EE and BB power spectra for the region outside the P06 mask. To increase the signal‐to‐noise ratio, multiple values of ﹩l﹩ are averaged as indicated. Only statistical errors are shown. Negative values are not plotted. The frequency band combinations are given in Table 5. The thin red line running close to the ﹩l=2﹩ EE spectrum is the model in eq. (26). The dot‐dashed red line corresponds to eq. (25) evaluated for BB at ﹩l=2﹩.
Other Images in This Article
Show More
Copyright and Terms & Conditions
© 2007. The American Astronomical Society. All rights reserved. Printed in U.S.A.
Copyright ©
2025 Astronomy Image Explorer. All Rights Reserved.