Image Details
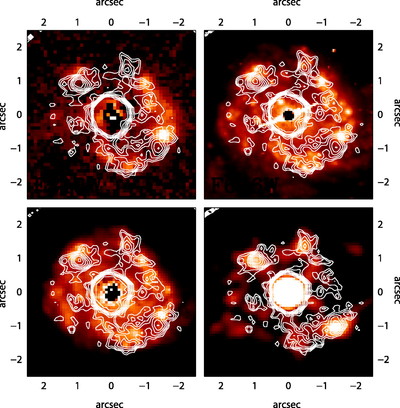
Caption: Fig. 9.
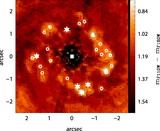
In all the images the contours are the MIR 12.5 μm emission (Soifer et al. 2003) superimposed on the UV F218W (top left), optical F606W (top right), NIR 1.1 μm (bottom left), and radio 8.4 GHz (bottom right; Colina et al. 2001; obtained in 1999 November) images. Note the excellent spatial correspondence between the MIR and radio emissions whereas, in general, the locations of brightest NIR, optical, and UV clusters (except those to the south of the nucleus; see § 6.2) do not correspond with the brightest peaks of MIR emission.
Other Images in This Article
Copyright and Terms & Conditions
© 2007. The American Astronomical Society. All rights reserved. Printed in U.S.A.
Copyright ©
2025 Astronomy Image Explorer. All Rights Reserved.