Image Details
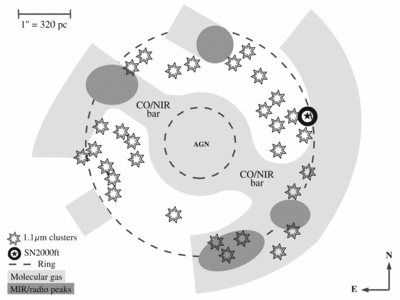
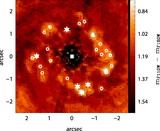
Caption: Fig. 10.
Sketch of the nuclear region of NGC 7469. The approximate locations of the 1.1 μm–selected star clusters are marked with stars. The places where there is molecular gas (traced by CO ﹩J=2{\mbox{--}} 1﹩ emission) are shaded in light gray, whereas the most intense MIR/radio‐emitting regions are shaded in dark gray. The location of SN2000ft (Colina et al. 2001, 2007) is shown as a black star.
Other Images in This Article
Copyright and Terms & Conditions
© 2007. The American Astronomical Society. All rights reserved. Printed in U.S.A.
Copyright ©
2025 Astronomy Image Explorer. All Rights Reserved.