Image Details
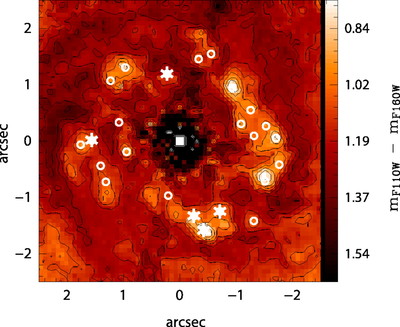
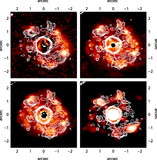
Caption: Fig. 8.
The ﹩m_{\mathrm{F}\,110\mathrm{W}\,}-m_{\mathrm{F}\,160\mathrm{W}\,}﹩ color map (equivalent to a ﹩J-H﹩ color map). Colors redder than ﹩m_{\mathrm{F}\,110\mathrm{W}\,}-m_{\mathrm{F}\,160\mathrm{W}\,}\sim 1.03﹩ (typical of an old stellar population, although younger ionizing stellar populations will be bluer, see Alonso‐Herrero et al. 2006b) are indicative of highly extincted regions. The young and intermediate‐age 1.1 μm selected star clusters are marked with star symbols and open circles, respectively. Because of the central region (﹩r\lesssim 0.5^{\prime \prime }﹩) is strongly affected by the subtraction of the nucleus, it does not show any real extinction variation.
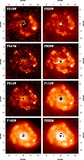
Other Images in This Article
Copyright and Terms & Conditions
© 2007. The American Astronomical Society. All rights reserved. Printed in U.S.A.