Image Details
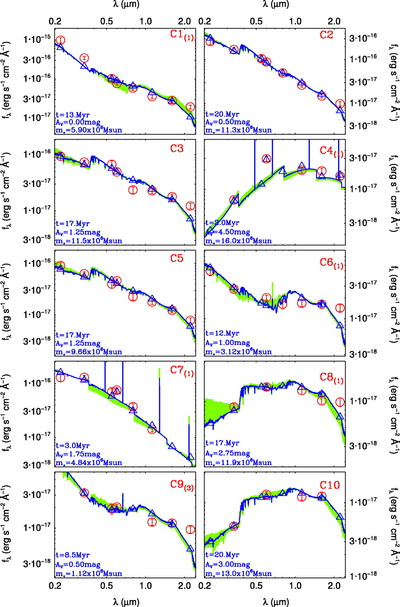
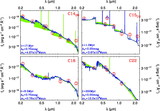
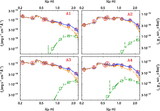
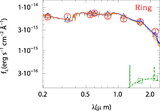
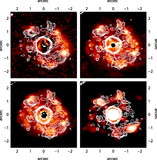
Caption: Fig. 4.
Fits to the photometric SEDs of the 1.1 μm–selected star cluster. The model SEDs (SB99) use instantaneous star formation, the Geneva tracks, and the Cal97 extinction law. The 10 brightest clusters, as well as the remaining 4 clusters with more than 3 degrees of freedom (see Table 7), are shown. Observational data points are shown as red circles with their corresponding 1 σ uncertainties. The blue line is the best fit to the data, and the blue triangles represent the photometric points resulting from convolving the best‐fit SED with the HST‐filter throughputs. The green regions represent the SED range of the youngest and oldest acceptable solutions (Table 7). The emission lines seen in the youngest SEDs are hydrogen recombination lines included in the modeling. As in Table 7, the number with a hash symbol next to a cluster label indicates the number of total additional counterparts that have been detected among all of the images.
Other Images in This Article
Copyright and Terms & Conditions
© 2007. The American Astronomical Society. All rights reserved. Printed in U.S.A.