Image Details

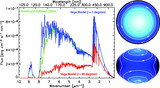
Caption: Fig. 8.
(a) Comparison between the SED of Bohlin & Gilliland (2004) and our best‐fitting (﹩\chi ^{2}_{\nu }=8.7﹩) rapidly rotating SED model for Vega: ﹩\omega =0.91﹩, ﹩T^{\mathrm{pole}\,}_{\mathrm{eff}\,}=10,150﹩ K, and ﹩\mathrm{log}\,( g) _{\mathrm{pole}\,}=4.10﹩. Also shown are the differences between this model and the data in (b) the region at shorter wavelengths observed by the IUE and (c) the region observed by the HST Space Telescope Imaging Spectrograph at longer wavelengths. At wavenumbers ﹩1/ \lambda < 2.38﹩ μm−1 the "observed" SED is represented by a closely fitting Kurucz model spectrum (see Bohlin & Gilliland 2004).
Other Images in This Article


Copyright and Terms & Conditions
© 2006. The American Astronomical Society. All rights reserved. Printed in U.S.A.