Image Details
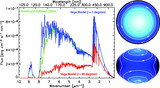
Caption: Fig. 5.
(a) CHARA/FLUOR ﹩V^{2}﹩ data (error bars) plotted as a function of projected baseline (for a range of azimuths, see Table 1) together with the best‐fitting Roche–von Zeipel synthetic squared visibilities. Model parameters: ﹩\omega =0.91﹩, ﹩\theta _{\mathrm{equ}\,}=3.329﹩ mas, ﹩T^{\mathrm{pole}\,}_{\mathrm{eff}\,}=10,250﹩ K, ﹩\mathrm{log}\,( g) _{\mathrm{pole}\,}=4.10﹩. The best‐fit ﹩\chi ^{2}_{\nu }=1.31﹩. (b) Deviations of the best‐fit model from observed squared visibilities. The dotted and dashed lines indicated the 1 and 2 ﹩\sigma ﹩ deviations.
Other Images in This Article


Copyright and Terms & Conditions
© 2006. The American Astronomical Society. All rights reserved. Printed in U.S.A.
Copyright ©
2025 Astronomy Image Explorer. All Rights Reserved.