Image Details
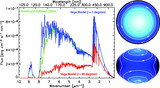
Caption: Fig. 1.
Sampling of the ﹩\left(u,\ v\right)﹩‐plane for the CHARA/FLUOR Vega data set. The diamonds represent the monochromatic sampling at 2.0 μm within the ﹩K^{\prime }﹩ band. In the ﹩K^{\prime }﹩ band, the CHARA baselines E2‐W2, E2‐W1, E2‐S1, and W2‐S1 sample the lower first lobe, first null, and second lobe of Vega’s visibility curve. Two‐telescope observations have a 180° ambiguity in the position angle, therefore we plot two coordinates, (﹩u,\ v﹩) and (﹩-u,\ -v﹩), for each of the 25 data points. These (﹩u,\ v﹩) points overlay a model for Vega’s two‐dimensional monochromatic Fourier appearance. This squared visibility model is a Fast Fourier Transform (displayed with a logarithmic stretch) of a synthetic intensity map of Vega in the plane of the sky (see Fig. 3).
Other Images in This Article


Copyright and Terms & Conditions
© 2006. The American Astronomical Society. All rights reserved. Printed in U.S.A.