Image Details
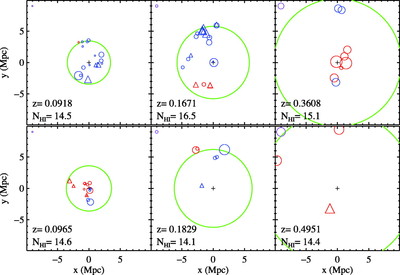
Caption: Fig. 7.
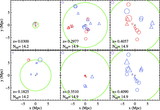
Spatial distribution of galaxies around PKS 0405−123 for each of the metal‐line absorption systems detected along the sight line. Galaxies are color‐coded according to their velocity offset from the absorption system; blue is for negative velocities relative to the absorption system, and red is for positive velocities. Circles indicate ﹩\vert \delta v\vert < 500﹩ km s−1, and triangles are for ﹩1000\ \mathrm{km}\,\ \mathrm{s}\,^{-1}> \vert \delta v\vert > 500﹩ km s−1. The size of the symbol is proportional to the luminosity of the galaxy. The purple circle in the upper left corner of each subpanel corresponds to ﹩R=20﹩ mag, i.e., the magnitude limit of the inner 10﹩\arcmin﹩ of the survey. This corresponds to ﹩L\approx L_{*}/ 10﹩ at ﹩z=0.1﹩ and ﹩L\approx L_{*}﹩ at ﹩z=0.25﹩. The green circle in each subplot shows the approximate radial limit of the survey (36﹩\arcmin﹩).
Other Images in This Article
Copyright and Terms & Conditions
© 2006. The American Astronomical Society. All rights reserved. Printed in U.S.A.