Image Details
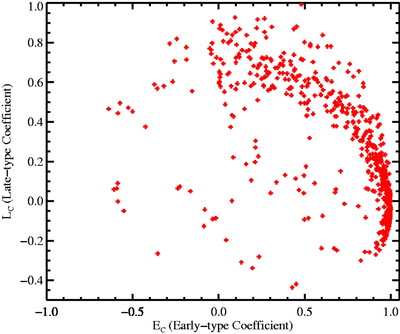
Caption: Fig. 6.
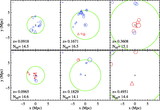
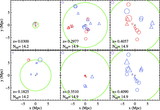
Scatter plot of the early and late‐type coefficients, defined as described in the text. With a few exceptions, the galaxies follow a well‐defined locus. The majority of outliers are either quasars or galaxies at very high redshift where we have limited data for spectral typing.
Other Images in This Article
Copyright and Terms & Conditions
© 2006. The American Astronomical Society. All rights reserved. Printed in U.S.A.
Copyright ©
2025 Astronomy Image Explorer. All Rights Reserved.