Image Details
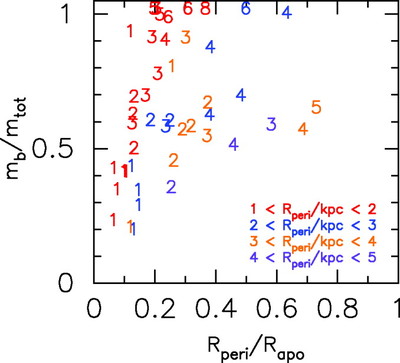
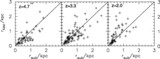
Caption: Fig. 12.
Distribution of mb/mtot against Rperi/Rapo in the galactic halo at ﹩z=2.0﹩. Red, blue, orange, and purple numbers indicate different ranges of the pericentric distance from ﹩1< R_{\mathrm{peri}\,}/ \mathrm{kpc}\,< 2﹩ to ﹩4< R_{\mathrm{peri}\,}/ \mathrm{kpc}\,< 5﹩, and the numbers indicate how many times each clump passes the pericenter. We obtain pericenters and apocenters from the most recent period of the clumps. Note that we do not consider clumps that have never passed pericenters or larger pericentric distances ﹩R_{\mathrm{peri}\,}> 5﹩ kpc in this plot.
Other Images in This Article
Show More
Copyright and Terms & Conditions
© 2006. The American Astronomical Society. All rights reserved. Printed in U.S.A.
Copyright ©
2026 Astronomy Image Explorer. All Rights Reserved.