Image Details
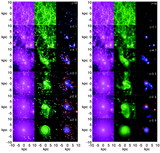
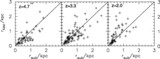
Caption: Fig. 3.
Circular velocity profiles of four randomly selected clumps at ﹩z=2.0﹩. The circular velocities are estimated by ﹩[ GM( < r) / r] ^{1/2}﹩, where r is the distance from the center of the clump and ﹩M( < r) ﹩ is the mass within r. We plot from 0 to 3rsub for r. The upward‐pointing arrows indicate the positions of the rsub values, and the open circles represent the minimum points of the circular profiles.
Other Images in This Article
Show More
Copyright and Terms & Conditions
© 2006. The American Astronomical Society. All rights reserved. Printed in U.S.A.
Copyright ©
2026 Astronomy Image Explorer. All Rights Reserved.