Image Details
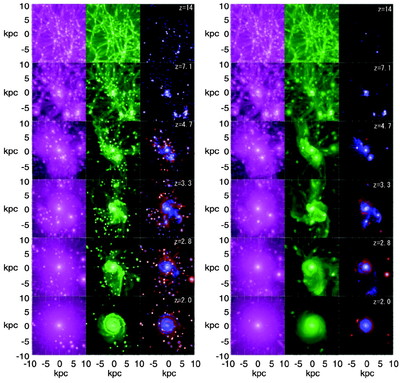
Caption: Fig. 2.
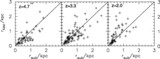
Effects of low‐temperature cooling (﹩T< 10^{4}﹩ K) on clump formation in a galaxy. In model A, the gas can cool below ﹩T< 10^{4}﹩ K, whereas cooling above ﹩T=10^{4}﹩ K is assumed in model B. The left, middle, and right panels in each model show the distribution of dark matter, gas, and star particles, respectively. Blue and red in each right panel indicate young (﹩\mathrm{age}\,\leq 0.1﹩ Gyr) and old star particles, respectively. The brightness of each particle represents the local density of each particle.
Other Images in This Article
Show More
Copyright and Terms & Conditions
© 2006. The American Astronomical Society. All rights reserved. Printed in U.S.A.
Copyright ©
2026 Astronomy Image Explorer. All Rights Reserved.