Image Details
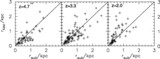
Caption: Fig. 1.
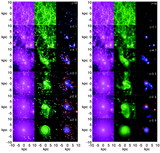
Phase diagram and limits of resolution. The Jeans instability of the gas above the lines can be calculated properly in SPH simulations. The solid, dashed, dash‐dotted, and dotted lines indicate Jeans mass limits ﹩M_{\mathrm{Jeans}\,}=2N_{\mathrm{nb}\,}M_{\mathrm{SPH}\,}﹩, with mass resolutions of a single SPH particle of ﹩M_{\mathrm{SPH}\,}=10^{3}﹩, 104, 105, and 106 M⊙, respectively. In the figure, we assume ﹩N_{\mathrm{nb}\,}=50﹩, ﹩\mu =0.59﹩, and ﹩\gamma =5/ 3﹩. The contour map represents the volume‐weighted phase diagram from the numerical simulation of the multiphase ISM in a galaxy (Wada & Tomisaka 2005).
Other Images in This Article
Show More
Copyright and Terms & Conditions
© 2006. The American Astronomical Society. All rights reserved. Printed in U.S.A.