Image Details
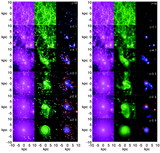
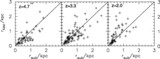
Caption: Fig. 11.
Distribution of mb/mtot in the galactic halo at ﹩z=2.0﹩. The left panel shows mb/mtot against Rh. On the other hand, the right panel shows mb/mtot against the pericentric distance, Rperi. Plus signs in the panels represent each clump. The open circle in the right panel is the clump that is preprocessed by the other halos.
Other Images in This Article
Show More
Copyright and Terms & Conditions
© 2006. The American Astronomical Society. All rights reserved. Printed in U.S.A.
Copyright ©
2026 Astronomy Image Explorer. All Rights Reserved.