Image Details
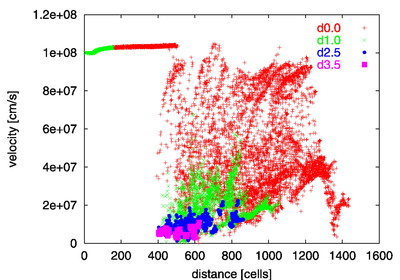
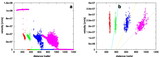
Caption: Fig. 10.
Scatter plot of velocity vs. distance from the central star is shown for RUN 2 including low‐density gas. Some of it is slowed down to near stationarity and then reaccelerated to almost the original wind speed. The coding is shown, the number representing the ﹩\mathrm{log}\,10﹩ of the top of the bin of number density included in that symbol. Except for d3.5, not every cell has been plotted, considering the large number of cells of the simulations. For the different density bins only every 1 cell in 20 (d0.0), 5 (d1.0), and 3 (d2.5) have been used in order to not saturate the plot.
Other Images in This Article

Show More
Copyright and Terms & Conditions
© 2004. The American Astronomical Society. All rights reserved. Printed in U.S.A.