Image Details
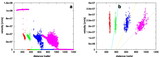
Caption: Fig. 11.
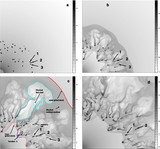
Density‐velocity scatter plots for the simulations with and without initial clumps are shown on the right and left, respectively. The population is clearly distinctive. In the clumpy simulation the low‐density gas has velocity over the whole range, whereas it is concentrated in a rather narrow band in the RUN without preexisting clouds. The highest density clumps share the postshock velocities of the band around ﹩200\ \mathrm{km}\,\ \mathrm{s}\,^{-1}﹩ in RUN 1 (a), whereas in RUN 2 (b) the densest clumps have very low velocities that increase slowly toward lower densities. For technical reasons only every twentieth cell is plotted.
Other Images in This Article
Show More
Copyright and Terms & Conditions
© 2004. The American Astronomical Society. All rights reserved. Printed in U.S.A.