Image Details
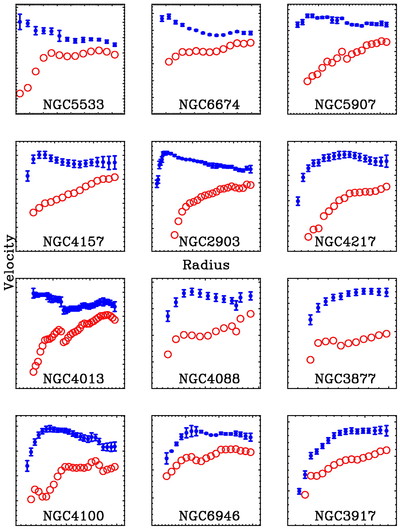
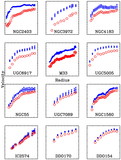
Caption: Fig. 9.
Rotation curves V(r) for individual galaxies with good data (filled circles) together with those inferred for the dark matter halo Vh(r) after subtraction of the baryonic component (open circles). The case of ﹩Q=1﹩ is illustrated here. All plots have (0, 0) at the bottom left corner. Tick marks are 1 kpc along the abscissa and 10 km s−1 along the ordinate. Galaxies are arranged in order of decreasing velocity, from ﹩V_{\mathrm{max}\,}\approx 300﹩ km s−1 for NGC 5533 to ﹩V_{\mathrm{max}\,}\approx 50﹩ km s−1 for DDO 154. There is a wide variety in Vh(r), ranging from nearly hollow halos to those that dominate down to small radius.
Other Images in This Article

Copyright and Terms & Conditions
© 2004. The American Astronomical Society. All rights reserved. Printed in U.S.A.