Image Details
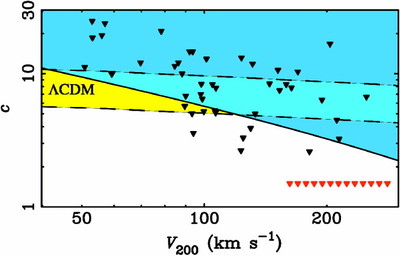
Caption: Fig. 8.
Diagram showing the parameter space of NFW halos. The dashed lines enclose the region in which NFW halos are expected to reside for the cosmological parameters derived from WMAP (Bennett et al. 2003). These lines are drawn for the ±1 σ range of scatter in concentration ﹩\sigma _{c}=0.14﹩ determined by Weschler et al. (2002). The blue region above the solid line is excluded by the maximum halo acceleration limit ηacrit (Brada & Milgrom 1999). This excludes most of the expected parameter space. Also shown are the upper limits on the concentrations of individual galaxies (filled triangles) measured in the limit ﹩\Upsilon _{*}=0﹩ by de Blok et al. (2001), de Blok & Bosma (2002), and Swaters et al. (2003). Those objects that would fall outside the boundaries of this plot because of exceedingly low concentrations are plotted as the row of red filled triangles at lower right. Individual galaxies need not have halos that achieve the maximum acceleration limit, so such individual cases can be more restrictive (i.e., below the solid line). These are inevitably LSB galaxies with ﹩a< a_{0}﹩ at all radii.
Other Images in This Article

Copyright and Terms & Conditions
© 2004. The American Astronomical Society. All rights reserved. Printed in U.S.A.