Image Details
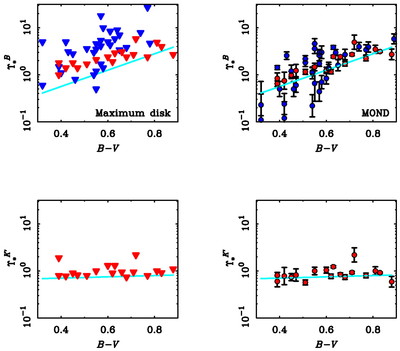
Caption: Fig. 7.
Stellar mass‐to‐light ratios of disks in the B band (top) and K﹩\arcmin﹩ band (bottom) as a function of ﹩B-V﹩ color for the cases of maximum disk (left) and MOND (right). Each filled circle represents one galaxy for which the requisite data exist. The line represents the mean expectation of stellar population synthesis models from Bell et al. (2003b). These lines are completely independent of the data: neither the normalization nor the slope has been fitted to the dynamical data.
Other Images in This Article


Copyright and Terms & Conditions
© 2004. The American Astronomical Society. All rights reserved. Printed in U.S.A.
Copyright ©
2025 Astronomy Image Explorer. All Rights Reserved.