Image Details
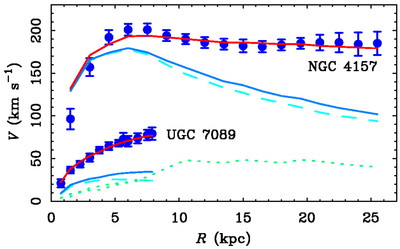
Caption: Fig. 1.
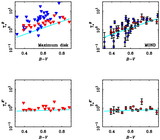
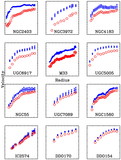
Examples of the data for two galaxies from the study of Sanders & Verheijen (1998). The filled circles with error bars are the measured rotation curves of NGC 4157 and UGC 7089. The dashed lines are the contribution to the rotation by the stars, ﹩V_{*}( r) ﹩, as determined from K﹩\arcmin﹩‐band surface photometry. The dotted lines are the contribution of the gas, Vg(r). Note that the gas distributions of these two very different galaxies are rather similar for ﹩r< 8﹩ kpc, so that the dotted lines nearly overlap. The lower solid lines represent the total baryonic contribution, Vb(r) (stars plus gas). The upper solid lines are the MOND fits. These are, in effect, a version of Vb(r) scaled by the MOND interpolation function μ(x). Even if MOND is wrong as a theory, this scaling provides an empirical relation between the distribution of observable baryons and that of the dark mass.
Other Images in This Article


Copyright and Terms & Conditions
© 2004. The American Astronomical Society. All rights reserved. Printed in U.S.A.