Image Details
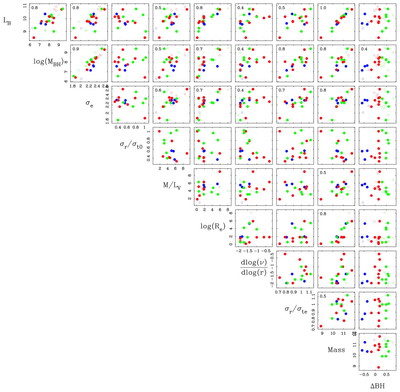
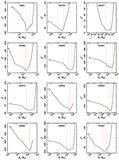
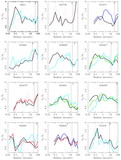
Caption: Fig. 9.
Ten galaxy properties plotted against each other, for the galaxies that have measured BH masses. For this plot, we include up to 31 galaxies; the BH masses are the same as in Tremaine et al. (2002). The colors represent the offset from the MBH/σ correlation as defined in Tremaine et al. (2002), with green having the largest positive BH offset, blue having the largest negative offset, and red having small offset. The number written in the upper left‐hand corner of the plot is the Pearson’s R correlation coefficient. If the probability from the correlation is below 10%, we do not report R. Filled symbols are the 17 galaxies that have orbit‐based models; the rest are plotted with open symbols.
Other Images in This Article
Show More
Copyright and Terms & Conditions
© 2003. The American Astronomical Society. All rights reserved. Printed in U.S.A.