Image Details
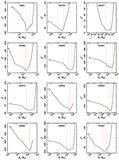
Caption: Fig. 2.
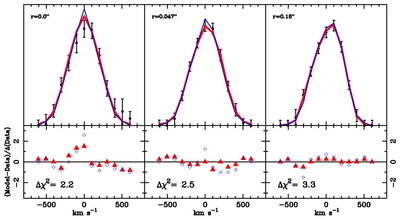
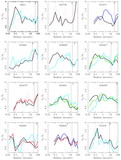
Comparison of the LOSVD from three of the 33 velocity profiles in NGC 4564; the radii are given in the upper left‐hand corner of each panel. In the upper panels, the filled circles with error bars represent the data LOSVDs. The lines in the upper panels represent two different models, and the lower panels show their residuals from the data normalized by dividing by the uncertainty in the data. The red line and triangles are the values from the best‐fit BH model; the blue line and open circles are the model without a BH. The Δχ2 value given at the bottom is the difference between the best‐fit model and the zero BH mass model for that particular bin. These three bins contribute a total of ﹩\Delta \chi ^{2}=8.0﹩, whereas the difference from the full sample is 52.7.
Other Images in This Article
Show More
Copyright and Terms & Conditions
© 2003. The American Astronomical Society. All rights reserved. Printed in U.S.A.