Image Details
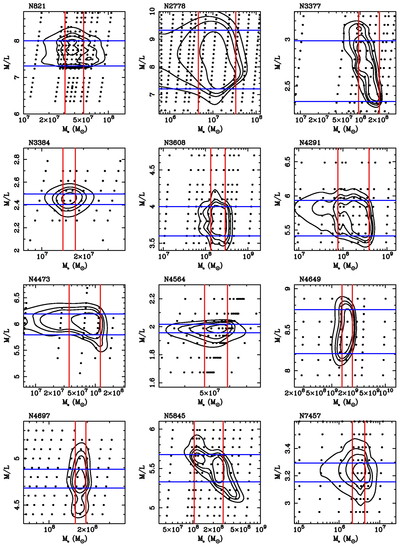
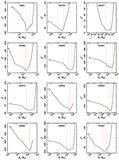
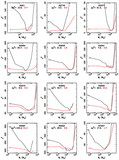
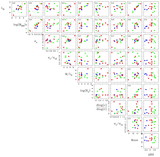
Caption: Fig. 3.
Two‐dimensional plots of χ2 as a function of BH mass and mass‐to‐light ratio for each of the galaxies. The points represent models that we ran. The contours were determined by a two‐dimensional smoothing spline interpolated from these models and represent Δχ2 of 1.0, 2.71, 4.0, and 6.63 (corresponding to 68%, 90%, 95%, and 99% for 1 degree of freedom). The red vertical lines are the 68% limits for the BH masses marginalized over mass‐to‐light ratio, and the blue horizontal lines are the 68% limits for the mass‐to‐light ratios marginalized over BH mass.
Other Images in This Article
Show More
Copyright and Terms & Conditions
© 2003. The American Astronomical Society. All rights reserved. Printed in U.S.A.
Copyright ©
2025 Astronomy Image Explorer. All Rights Reserved.