Image Details
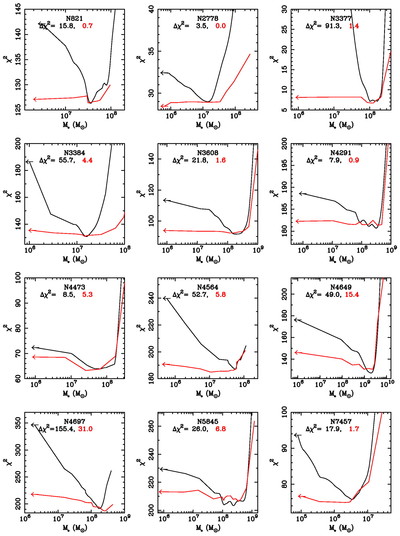
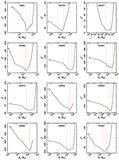
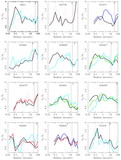
Caption: Fig. 7.
χ2 as a function of BH mass using two sets of spectral data for each galaxy. The solid lines are the same as in Fig. 5, where we have included all of the spectral data (i.e., both HST and ground‐based observations). The red lines are the results when only including the ground‐based spectral data, excluding the HST spectra; an offset has been added to the ground‐based χ2 values in order to compare better with the solid lines. Below the galaxy name, we have included the change in χ2 between the zero BH model and the best‐fit BH model, for both HST plus ground‐based spectroscopy (first entry) and only ground‐based spectral data (second entry). In every case, the significance of the BH detection is greatly enhanced by including the HST spectral data.
Other Images in This Article
Show More
Copyright and Terms & Conditions
© 2003. The American Astronomical Society. All rights reserved. Printed in U.S.A.